Application: Stellar Colors#
Stellar colors are expressed as the difference in astronomical magnitudes with the flux measured through different filters.
The standard photometric system defines U, B, V, and more filters, where U is ultraviolet, B is blue, and V from which we can define a color index like \(B-V\) (where here, \(B\) is now the magnitude of the star through the B filter).
Note
It is \(B-V\) that traditionally appears as the \(x\)-axis in the Hertzsprung-Russel diagram.
\(B-V\) is a difference in magnitudes, which can be expressed as:
where \(f_B\) is the flux received from a star through the B filter and \(f_V\) is the flux from a star through the V filter.
We can treat a star as a perfect blackbody (narrator: they are not), and then take
where \(B_\lambda(T)\) is the Planck function for temperature \(T\), and \(s_X\) is the filter X’s response (I know, too many things are getting called B…). The “\(\approx\)” here is because the distance to the star, its radius, and the fact that we need to integrate the Planck function over the outward angles all introduce a proportionality constant. However, since we are taking the ratio of fluxes, this proportionality constant will cancel.
Simple box filter#
We will take the filter to be a box-filter, with:
(i.e., the filter only lets light through in a narrow band of width \(d\lambda_X\) centered on a wavelength \(\lambda_{0,X}\).) Reasonable values for the filter properties are:
filter |
\(\lambda_{0,X}\) |
\(d\lambda_{X}\) |
|---|---|---|
B |
445 nm |
90 nm |
V |
550 nm |
90 nm |
Zero-point#
There is one further complication. Magnitudes have a zero-point (calibration). It used to be that Vega was taken to have a magnitude of 0 in all filters (but Vega is variable, so a different procedure is used now).
We will assume something Vega-like, and define \(B - V = 0\) for \(T = 10000~\mathrm{K}\). This means that you will need to shift your results by a constant offset.
Implementation#
import numpy as np
import matplotlib.pyplot as plt
Let’s start by defining the Planck function. We’ll work in CGS units (unlike in class where we made this dimensionless).
def B(lam, T=1.e4):
    """Planck function.  Here lambda is wavelength in cm,
    T is temperature in K"""
    k = 1.38e-16
    h = 6.63e-27
    c = 3.e10
    # we need to take the limit x -> 0 if the input x is 0
    return np.where(lam == 0, 0,
                    2 * h * c**2 / lam**5 / np.expm1(h*c/(lam*k*T)))
Tip
I am using np.expm1() here, which is a more accurate way of computing \(e^x - 1\) for small \(x\).
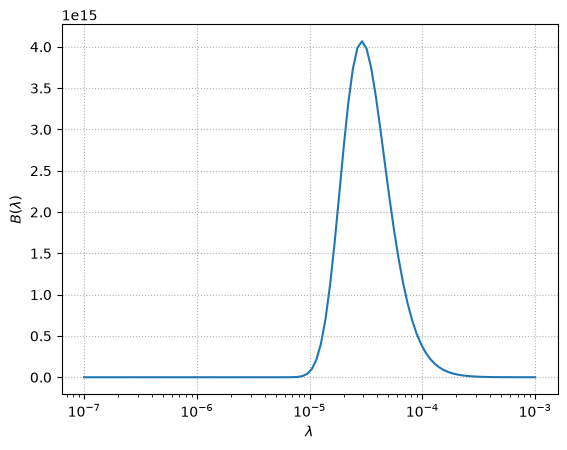
Let’s just make sure that our \(B(\lambda)\) looks like it should. For \(T = 10^4~\mathrm{K}\), it should peak in the visible.
fig, ax = plt.subplots()

T = 1.e4
lam = np.logspace(-7, -3, 100)

ax.plot(lam, B(lam, T))
ax.set_xscale("log")
ax.set_xlabel(r"$\lambda$")
ax.set_ylabel(r"$B(\lambda)$")
ax.grid(ls=":")
/tmp/ipykernel_3482/55925149.py:9: RuntimeWarning: overflow encountered in expm1
  2 * h * c**2 / lam**5 / np.expm1(h*c/(lam*k*T)))
Now let’s define the filters (I’ll include U here for fun). This stores \(\lambda_0\) and \(d\lambda\) for each filter in a dict keyed on the filter name.
filters = {"U": (365e-7, 70e-7),
           "B": (445e-7, 90e-7),
           "V": (550e-7, 90e-7)}
Next, we’ll write a function that computes the filter’s response.
def filter_response(lam, lambda0, dlambda=50e-7):
    return np.where(np.logical_and(lam > lambda0-0.5*dlambda,
                                   lam < lambda0+0.5*dlambda), 1.0, 0.0)
and then a function that combines the filter and the Planck function — this will be our integrand.
Note
I use a * here on the tuple that holds the filter parameters—this is an example of the python unpacking operator.
def filtered_B(lam, T=1.e4, filter="B"):
    return B(lam, T=T) * filter_response(lam, *filters[filter])
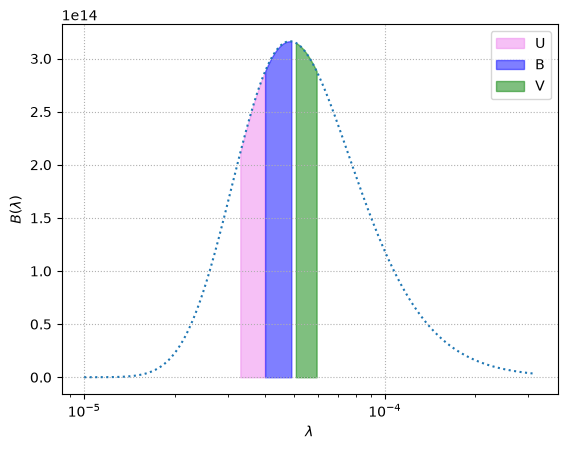
Now let’s plot this filtered Planck function to see what it looks like.
T = 6000

lam = np.logspace(-5, -3.5, 1000)

fig, ax = plt.subplots()

window = filtered_B(lam, T=T, filter="U")
idx = np.where(window != 0.0)
ax.fill_between(lam[idx], window[idx],
                label="U", color="violet", alpha=0.5)

window = filtered_B(lam, T=T, filter="B")
idx = np.where(window != 0.0)
ax.fill_between(lam[idx], window[idx],
                label="B", color="blue", alpha=0.5)

window = filtered_B(lam, T=T, filter="V")
idx = np.where(window != 0.0)
ax.fill_between(lam[idx], window[idx],
                label="V", color="green", alpha=0.5)

ax.plot(lam, B(lam, T=T), ls=":")

ax.set_xscale("log")
ax.set_xlabel(r"$\lambda$")
ax.set_ylabel(r"$B(\lambda)$")
ax.legend()
ax.grid(ls=":")
Integrating#
We have different options for doing the integrals. Since our \(s(x)\) is just a step function, we actually need to just integrate:
so we don’t need to use the machinery we developed in class for dealing with integrals to \(\infty\).
I’ll still use that here though, just because we might want to consider a different filter someday…
Let’s define the transform functions and a composite trapezoid rule that works with them:
SMALL = 1.e-30

def zv(x, alpha=1):
    """ transform the variable x -> z """
    return x/(alpha + x)

def xv(z, alpha=1):
    """ transform back from z -> x """
    return alpha*z/(1.0 - z + SMALL)
def I_t(func, N=10, alpha=5, args=None):
    """composite trapezoid rule for integrating from [0, oo].
    Here N is the number of intervals"""

    if args is None:
        args = ()

    # there are N+1 points corresponding to N intervals
    z = np.linspace(0.0, 1.0, N+1, endpoint=True)

    I = 0.0
    for n in range(N):
        I += 0.5 * ((z[n+1] - z[n]) *
                    (func(xv(z[n], alpha), *args) / (1.0 - z[n] + SMALL)**2 +
                     func(xv(z[n+1], alpha), *args) / (1.0 - z[n+1] + SMALL)**2))
    I *= alpha
    return I
Now, we want to compute the zero-point of \(B-V\) as that of a \(T = 10^4~\mathrm{K}\) star. We’ll call this BV0:
T = 10000
BV0 = -2.5*np.log10(I_t(filtered_B, N=250,
                        alpha=filters["B"][0], args=(T, "B")) /
                    I_t(filtered_B, N=250,
                        alpha=filters["V"][0], args=(T, "V")))
/tmp/ipykernel_3482/55925149.py:9: RuntimeWarning: divide by zero encountered in scalar divide
  2 * h * c**2 / lam**5 / np.expm1(h*c/(lam*k*T)))
/tmp/ipykernel_3482/55925149.py:9: RuntimeWarning: invalid value encountered in scalar divide
  2 * h * c**2 / lam**5 / np.expm1(h*c/(lam*k*T)))
/tmp/ipykernel_3482/55925149.py:9: RuntimeWarning: overflow encountered in expm1
  2 * h * c**2 / lam**5 / np.expm1(h*c/(lam*k*T)))
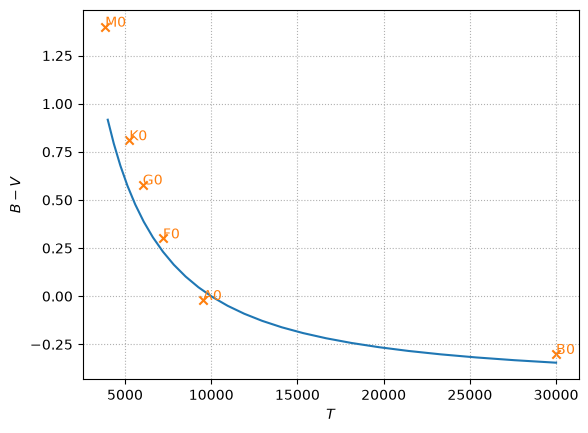
Finally, let’s compute all of the \(B-V\) for different \(T\), making sure to correct with BV0:
Ts = np.logspace(np.log10(4000), np.log10(30000), 25)
BVs = []

for T in Ts:
    BV = -2.5*np.log10(I_t(filtered_B, N=250,
                           alpha=filters["B"][0], args=(T, "B")) /
                       I_t(filtered_B, N=250,
                           alpha=filters["V"][0], args=(T, "V"))) - BV0
    BVs.append(BV)
/tmp/ipykernel_3482/55925149.py:9: RuntimeWarning: divide by zero encountered in scalar divide
  2 * h * c**2 / lam**5 / np.expm1(h*c/(lam*k*T)))
/tmp/ipykernel_3482/55925149.py:9: RuntimeWarning: invalid value encountered in scalar divide
  2 * h * c**2 / lam**5 / np.expm1(h*c/(lam*k*T)))
/tmp/ipykernel_3482/55925149.py:9: RuntimeWarning: overflow encountered in expm1
  2 * h * c**2 / lam**5 / np.expm1(h*c/(lam*k*T)))
fig, ax = plt.subplots()
ax.plot(Ts, BVs)
ax.grid(ls=":")
ax.set_xlabel("$T$")
ax.set_ylabel("$B-V$")
Text(0, 0.5, '$B-V$')
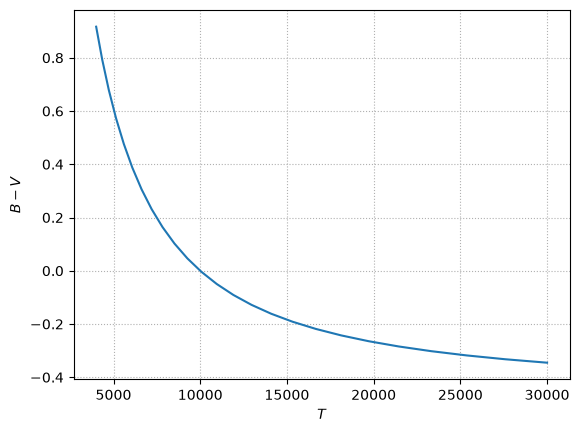
and we’ll add points for real stars
stars = [("B0", 30000, -0.30),
         ("A0", 9520, -0.02),
         ("F0", 7200, +0.30),
         ("G0", 6030, +0.58),
         ("K0", 5250, +0.81),
         ("M0", 3850, +1.40)]
for l, T, BV in stars:
    ax.scatter(T, BV, marker="x", color="C1")
    ax.text(T, BV, l, color="C1")
fig
Caution
You may have thought that you could just use scipy.integrate.quad to do the
integration from \([0, \infty]\), but it doesn’t get the right answer.
from scipy import integrate
T = 1.e4
I, err = integrate.quad(filtered_B, 0, np.inf, args=(T, "B"))
I
0.0
The issue here is that our integrand peaks at \(\lambda \sim 10^{-5}~\mathrm{cm}\)
and the quad() function simply does not notice this. We should instead make
the integrand dimensionless so the peak is near 1. We accomplished this manually
with our choice of \(\alpha\) in our method.
We can get do better if we restrict the integration limits
I, err = integrate.quad(filtered_B, 5.e-6, 2.e-4,
                        limit=100, args=(T, "B"))
I
25172574924.317474
But we really need to make the integrand dimensionless to get the best result here.