Debugging#
Every code has at least one bug and one extra line. Apply recursively.
A debugger lets you step through your code one line at a time and examine the state of any objects. This can help you understand why the code is not producing the results you expect.
We’ll look at two ways to debug. One on the command line using gdb
and the other in VS Code directly.
Example: integrating a function#
Let’s consider writing a program to compute the integral of a function:
In your calculus class, you learned that you can approximate an integral by dividing it into slabs and then adding up the area of each of those slabs:
where \(N\) is defined such that \(N = (b - a)/\Delta x\).
If we use just a single interval, this looks like:
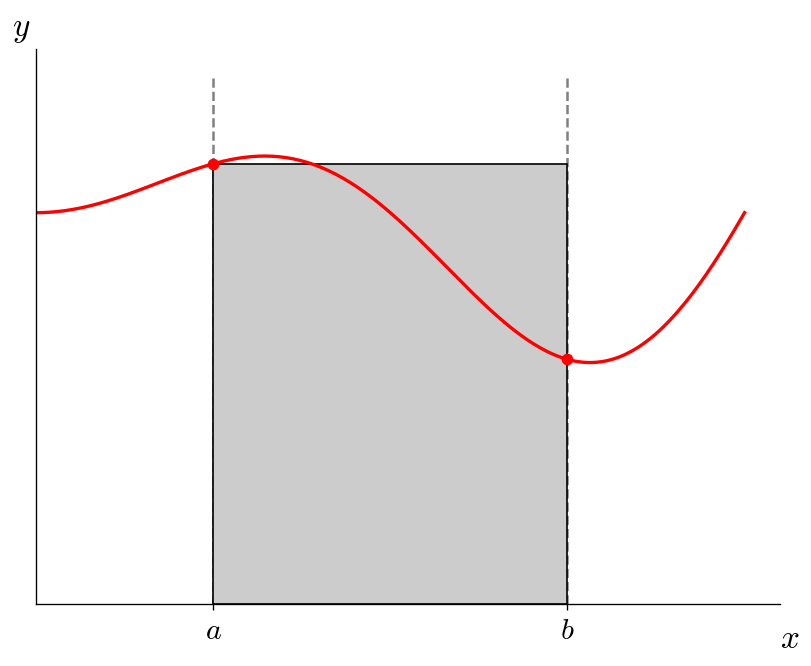
and the integral would be:
We can do slightly better by connecting the two endpoints:
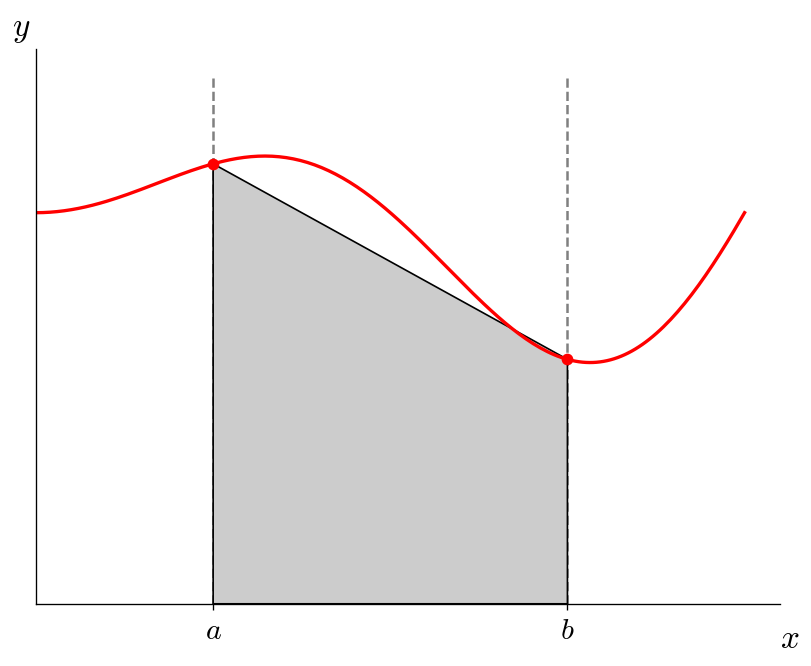
This looks like a trapezoid, and therefore this is called the trapezoid rule and has the integral:
To do better, we add intervals, for example, with \(N = 6\), we have:
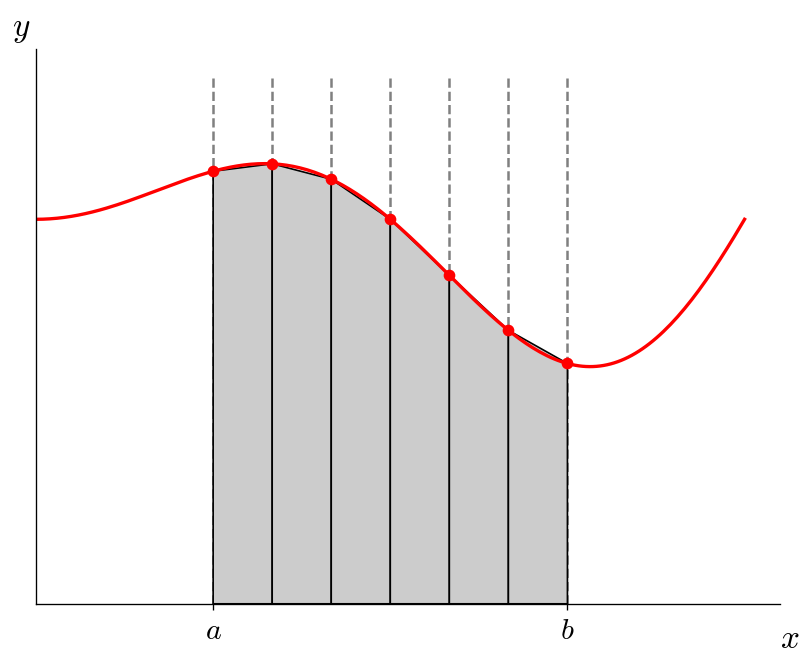
and the integral approximation is:
This is called the compound trapezoid rule
bugs!#
Here’s a buggy implementation of integrating
We know that the answer is \(I = \pi\).
#include <iostream>
#include <iomanip>
#include <cmath>
#include <cassert>

double f(double x) {
    return std::sin(x) * std::sin(x);
}


void integrate(int N, double xmin, double xmax, double I) {

    double dx = (xmax - xmin) / N;

    double xleft{xmin};
    double fleft = f(xleft);

    double xright{0.0};
    double fright{0.0};

    for (int n = 0; n <= N; ++n) {

        xright = xmin + (n+1) * dx;
        fright = f(xright);

        I += 1/2 * dx * (fleft + fright);

        xleft = xright;
        fleft = fright;
    }

}

int main() {

    int N{-1};

    std::cout << "enter the number of intervals: ";
    std::cin >> N;

    assert(N > 0);

    double I{0.0};

    double xmin{0.0};
    double xmax{2.0*M_PI};

    integrate(N, xmin, xmax, I);

    std::cout << "integral is " << std::setprecision(15) << I << std::endl;

}
Tip
There is more than one bug.
When we run this with 10 intervals, we get a result of 0—that’s clearly not correct!
We want to learn how to use a debugger to help us locate any issues.
gdb#
gdb is the GNU debugger. This runs on the command line and let’s us:
set breakpoints in the code where the execution pauses
step line-by-line through the code, diving into, or skipping over functions
inspect the value of any objects
Here’s a summary of some useful commands:
run: run the codecontinue: resume executionbreak: set a break point (give the line number)print: print a variable’s value (give the variable name)step: execute the next instructionnext: run the next line of code without diving into functionslist: show the code (give a line number to show code in that region)info breakpoints: show the current break pointsbt: show a backtrace
for most of these commands, we can just use the first letter, like b instead of break.
First we compile the code with the -g option:
g++ -g -o integrate integrate.cpp
then we run it though gdb as:
gdb ./integrate
Let’s set a breakpoint at line 21—that’s the start of the for loop in the integrate() function.
And then let’s run the code up to then:
b 21
run
we can see where we are using l and print out a variable with p, e.g.:
l
p xleft
p fleft
Now let’s step through the code and see if we can understand why I is not changing from 0, as well as whether
there are any other bugs…
VS Code#
We can debug directly in VS code. The same concepts described above apply. Let’s work our way through this.