Plotting#
We can use gnuplot to make simple plots.
Important
By default, gnuplot will display the plot in a window. This uses the Unix X Window System. This can work when we run directly on the machines in the MathLab.
If you use portal or portal2 then, when you ssh
into these remote machines, you need to add -Y to enable
forwarding of windows, e.g.,
ssh -Y username@portal.mathlab.stonybrook.edu
If you are using your own machine, you will need to install a X server. See our Using the remote servers documentation.
If you are unable to get this to work, you can still have gnuplot make an image file directly (e.g. PNG) instead, as shown below.
Interactive plotting#
Typically, we will plot columns from our output, making one column the x-axis and the other column the y-axis.
Let’s rerun our code, but redirect the output to a file:
./truncation_vs_roundoff > diff.out
If we look at the file diff.out (you can use cat, e.g.),
then we see there are 2 columns.
We can start gnuplot as:
gnuplot
The gnuplot program will give us a commandline interface that
lets us make plots, and now the prompt will be gnuplot>.
To make our plot, we can do:
plot 'diff.out' using 1:2 w l
There are a few parts to this:
This will use the data in
diff.outThe
using 1:2part means that the first column (gnuplot uses 1-based indexing) will be on the x-axis and the second column will be on the y-axis.The
w lpart means “with lines”, so the data will be draw using line segments instead of plotting points.
This plot will not look like what we saw previously, since it is using a linear scale, and we really want a log-scale to see the range of data. We can switch by doing:
set logscale
replot
By default, gnuplot shows a legend based on the plot command.
We can make this more descriptive by adding the title keyword:
plot 'diff.out' using 1:2 title "error" w l
or remove the title as:
plot 'diff.out' using 1:2 notitle w l
Now we can add axis labels:
set xlabel "dx"
set ylabel "error"
replot
Saving the plot#
To output as an image file (PNG), we can do:
set term png enhanced
set output "diff.png"
replot
Then you can exit gnuplot either by typing exit or using
Ctrl-d.
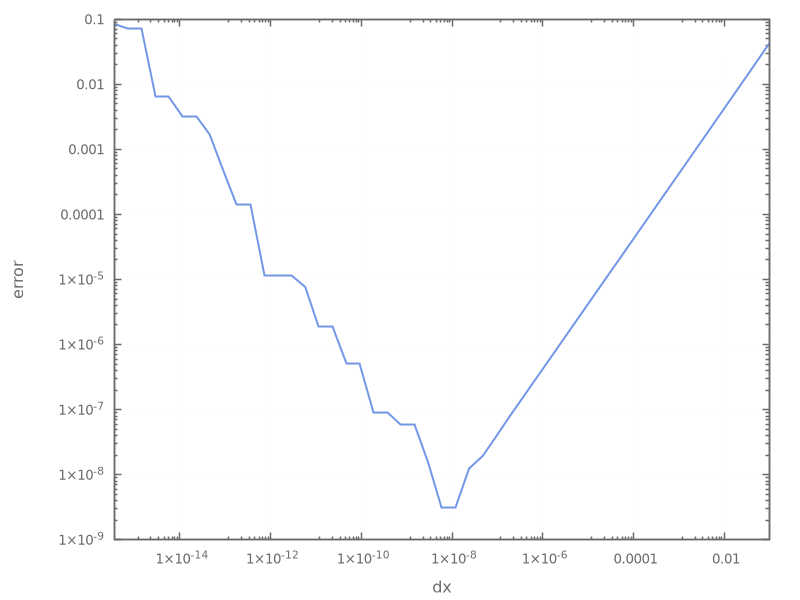
You should then see the file diff.png in your directory, which
should look like the plot from the previous page:
Using a plotting script#
We can put all of the plotting commands into a file, like diff.gp
(the extension, .gp is not standard, but here we use it to
indicate gnuplot). An example script is:
set term png enhanced size 800,600
set output "diff.png"

set logscale
set grid

set xlabel "dx"
set ylabel "error"

plot "diff.out" using 1:2 notitle with lines
and you would use this by doing:
gnuplot diff.gp
The key part of this is that the plot command comes at the very end.
Tip
If you could not get the X Window forwarding to work, then adapting
the script above is the easiest approach. You can then scp the
plot (diff.png in this case) to your local machine.