Solar Convection Zone#
We can get a feel for the extent of the Sun’s convection zone by looking at the MESA model for a \(1~M_\odot\) star on the main sequence.
import numpy as np
import matplotlib.pyplot as plt
import mesa_reader as mr
profile = mr.MesaData("M1_default_profile8.data")
We can look at where the models are convective by comparing \(\nabla\) and \(\nabla_\mathrm{ad}\).
First the H burning profiles
fig, ax = plt.subplots()

ax.plot(profile.mass, profile.gradT - profile.grada)

ax.set_xlabel(r"enclosed mass ($M_\odot$)")
ax.set_ylabel(r"$\nabla - \nabla_\mathrm{ad}$")
ax.set_xscale("log")
ax.grid(linestyle=":")
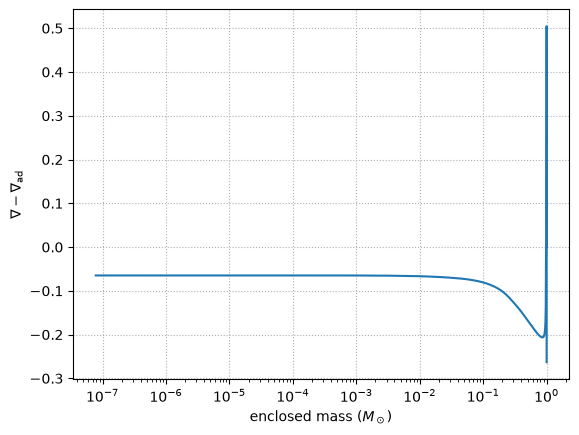
When we look at it this way, we see that essentially the entire mass of the Sun is radiative ($\nabla < \nabla_\mathrm{ad}).
Let’s visualize in terms of radius instead.
fig, ax = plt.subplots()

ax.plot(profile.radius, profile.gradT - profile.grada)

ax.set_xlabel(r"radius ($R_\odot$)")
ax.set_ylabel(r"$\nabla - \nabla_\mathrm{ad}$")
#ax.set_xscale("log")
ax.grid(linestyle=":")
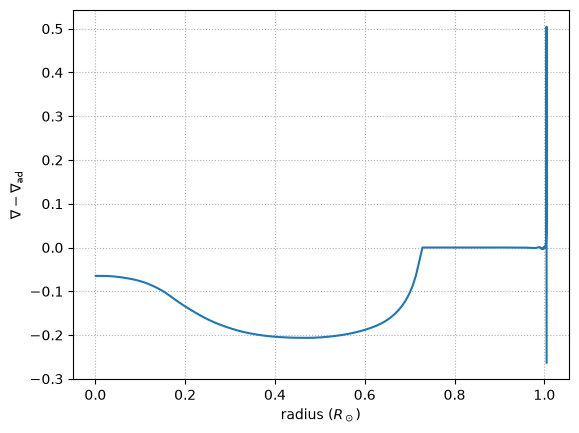
On this scale, we see that the Sun’s outer convective zone is ~ 1/3rd of its radius