Homework #6 ignition curves#
import matplotlib.pyplot as plt
import numpy as np
Here’s a function that returns \(\rho\) for a given \(T\) for H burning. The basic idea is that both the pp and CNO are of the form: $\(q = \rho A(T)\)\( so we can find \)\rho(T)\( via \)q = q_\mathrm{min}\( as: \)\(\rho = \frac{q_\mathrm{min}}{A(T)}\)$
Note that here I just use the sum of the pp and CNO rates instead of taking whichever is larger. You can uncomment the line with the np.where command to switch to taking the max.
For the composition, we assume solar, X = 0.7, Y = 0.28, Z = 0.02
def q_H(T, X=0.7, Z=0.02, q_min=1.e3):
    """return the density for the given temperature for H burning"""

    # we have either pp or CNO here
    # we write q_pp = rho A
    # we write q_CNO = rho B
    T_9 = T/1.e9
    A = 2.4e4*X**2*T_9**(-2./3.)*np.exp(-3.38/T_9**(1./3.))
    B = 4.4e25*X*Z*T_9**(-2./3.)*np.exp(-15.228/T_9**(1./3.))

    C = A + B
    # take which ever is larger
    #C = np.where(A > B, A, B)

    return q_min/C
For He burning, now we have \(q = \rho^2 A(T)\), so we can find the density as a function of temperature for some burning threshold \(q_\mathrm{min}\) as: $\(\rho = \sqrt{\frac{q_\mathrm{min}}{A(T)}}\)$
For the composition, we assume that H burning has finished before He burning sets in, so \(Y \sim 1\)
def q_He(T, Y=1.0, q_min=1.e3):
    """return the density for a given temperature for He burning"""

    T_8 = T/1.e8
    A = 5.09e11*Y**3*T_8**(-3)*np.exp(-44.027/T_8)
    return np.sqrt(q_min/A)
For plotting, it doesn’t make sense to evaluate these reaction rates outside of the range of temperatures where we expect these burning stages to take place.
T_H = np.logspace(6.8, 7.5, 100)

rho_H = q_H(T_H, q_min=1.e2)

T_He = np.logspace(7.9,8.3,100)
rho_He = q_He(T_He)
Conditions in the center of the Sun
T_sun = 1.5e7
rho_sun = 160
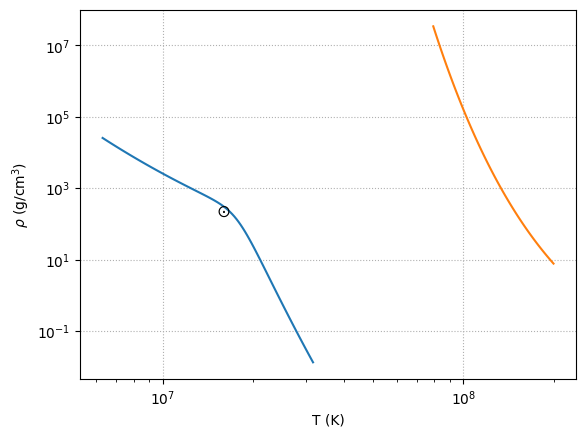
fig, ax = plt.subplots()
ax.loglog(T_H, rho_H)
ax.loglog(T_He, rho_He)
ax.text(T_sun, rho_sun, r"$\odot$", fontsize="large")
ax.set_xlabel(r"T (K)")
ax.set_ylabel(r"$\rho$ (g/cm$^3$)")
ax.grid(ls=":")

Note that our ignition curves are approximate, so the position of the Sun here is not quite past the H ignition curve. This is because our value for \(q_\mathrm{min}\) is probably too high for H burning.

